Quantitative research
Equity factor risk model
Understand what drives a portfolio.
A 15-factor equity risk model, brought out of the notebook and into an interactive portfolio workbench.
Runs locally in your browser against a saved model fitted on August 7, 2026. No account or market-data key required.
- stocks in the saved model
- 503
- sector + style factors
- 15
- model fit date
- 2026-08-07
- Contribution
- Personal research & implementation
01 / The problem
Understand what drives a portfolio.
A portfolio can look diversified by ticker while remaining concentrated in the same sources of risk. A list of holdings does not explain how sector exposure, style exposure, and stock-specific risk combine.
I built a factor model that separates those drivers, then made the saved model explorable without a Python environment. Edit positions, compare portfolios, and inspect the contribution of each factor to total variance.
02 / In practice
Follow the workflow.
Start with a sample portfolio or enter holdings and weights.
Inspect annualized risk, factor exposures, and signed risk contributions.
Change the allocation, compare it with a baseline, and export the analysis.
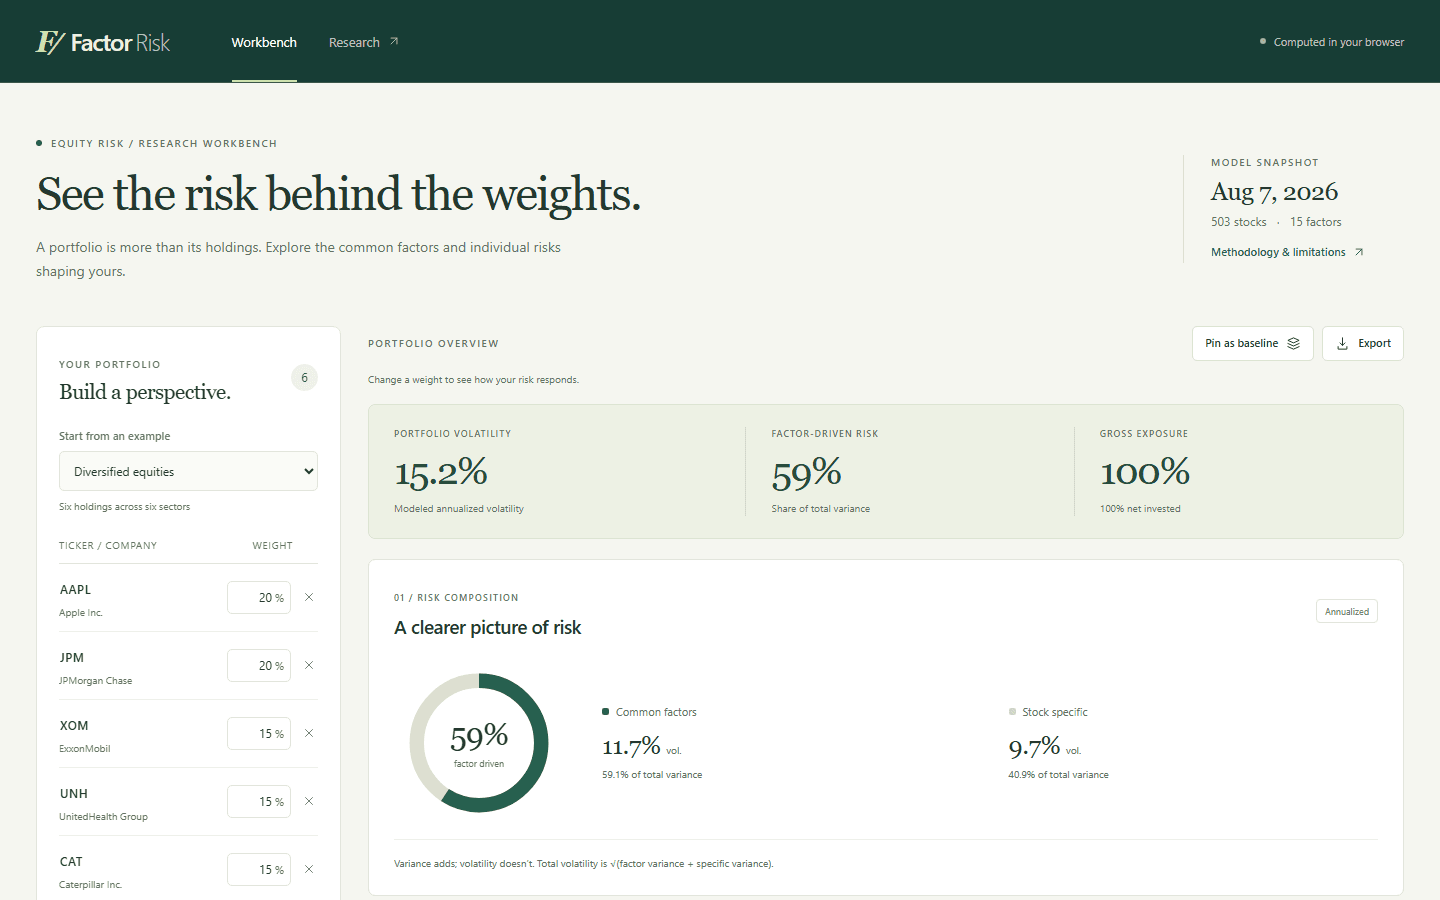
Runs locally in your browser against a saved model fitted on August 7, 2026. No account or market-data key required.
03 / Under the hood
How the pieces fit.
- 01
Estimate
Python builds 11 sector exposures and four style factors: Beta, Momentum, Size, and residual volatility.
- 02
Persist
The fitted exposure matrix, factor covariance, and specific variances are saved as portable CSV and JSON artifacts.
- 03
Analyze
The browser evaluates the same covariance decomposition for the entered holdings. The saved fit date stays visible.
- 04
Explain
Attribution separates common-factor risk from stock-specific risk and keeps negative contributions visible.
04 / Engineering judgment
Decisions & tradeoffs.
Explain risk through a smaller model
The model represents asset covariance as B F Bᵀ + D. It makes portfolio risk interpretable through common factors and a stock-specific remainder.
Use different memories for volatility and correlation
EWMA uses an 84-day volatility half-life and a 504-day correlation half-life, with Newey–West adjustments and a positive-semidefinite repair.
Preserve portfolio intent
Weights represent fractions of net asset value. Short positions and leverage are meaningful inputs; the interface must not silently normalize them away.
05 / Inspect the work