Mathematics & signal processing
Fourier signal lab
Build a signal from its frequencies.
An interactive laboratory for Fourier decomposition: draw a waveform, reconstruct it with harmonics, and inspect amplitude, phase, and approximation error.
The transform and reconstruction run in your browser. Presets and drawn signals are educational inputs, not recorded measurements.
- explicit numerical decomposition
- DFT
- inspectable spectrum
- Amplitude + phase
- reconstruction feedback
- Measured error
- Contribution
- Personal mathematical implementation
01 / The problem
Build a signal from its frequencies.
The Fourier series is often introduced as a formula or an animation. The interesting questions come from changing the signal: which frequencies matter, how phase affects shape, and why discontinuities behave differently from smooth curves.
I expanded an early Fourier visualization into a self-contained signal lab. It exposes the coefficients and connects harmonic selection to the reconstructed waveform and its error, so the mathematical explanation is tied to quantities you can inspect.
02 / In practice
Follow the workflow.
Choose a waveform or draw a periodic signal.
Change the harmonic cutoff and inspect individual amplitudes and phases.
Compare reconstruction methods and export a signal or visual for further analysis.
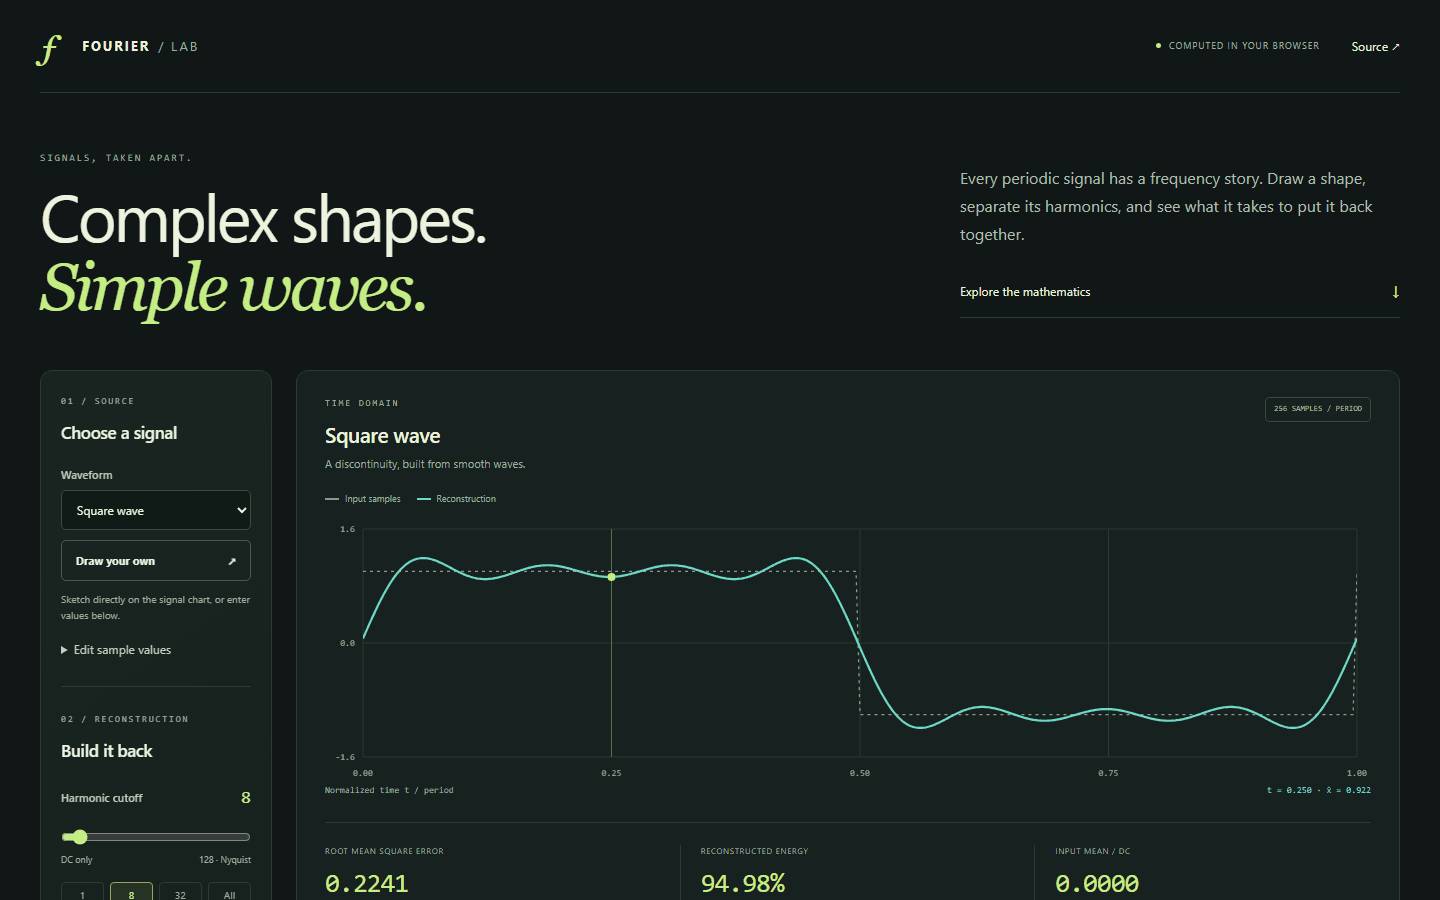
The transform and reconstruction run in your browser. Presets and drawn signals are educational inputs, not recorded measurements.
03 / Under the hood
How the pieces fit.
- 01
Sample
Represent one period as uniformly spaced real samples.
- 02
Transform
Compute complex Fourier coefficients from the samples.
- 03
Reconstruct
Combine selected frequency components, with optional Fejér weighting.
- 04
Measure
Compare the reconstruction against the input and inspect energy and error.
04 / Engineering judgment
Decisions & tradeoffs.
Keep the mathematics inspectable
The numerical transform and reconstruction are explicit. Tests check known signals and invariants rather than relying on a convincing-looking animation.
Explain the boundary conditions
A finite sampled period implies a periodic extension. Sampling limits the frequencies that can be distinguished, and a discontinuity produces Gibbs ringing under a sharp cutoff.
Compare two approximations
Fejér weighting reduces ringing by averaging partial sums, trading sharpness for smoother convergence. It provides a concrete alternative to simply adding more harmonics.
05 / Inspect the work