Reusable data visualization
Oura visualization library
Keep useful data visible when one source fails.
A reusable React library for Oura data, with a synthetic-data gallery and a more resilient loading pipeline for independent collections.
The gallery uses synthetic wellness data. It needs no Oura account or token and contains no personal health records.
- reusable chart components
- React
- independent collection loading
- Partial results
- public example data
- Synthetic
- Contribution
- Personal library & API integration
01 / The problem
Keep useful data visible when one source fails.
A dashboard built from several API collections should not disappear because one endpoint is unavailable. Consumers also need a way to understand chart behavior without connecting a personal account.
I built a React visualization library and expanded it with an inspectable synthetic gallery. The loader handles independent collection failures, pagination, and cancellation so charts can retain useful results without presenting stale data as current.
02 / In practice
Follow the workflow.
Explore the gallery without authenticating.
Change the visible data range and inspect chart states.
Use the source and package documentation to integrate the components.
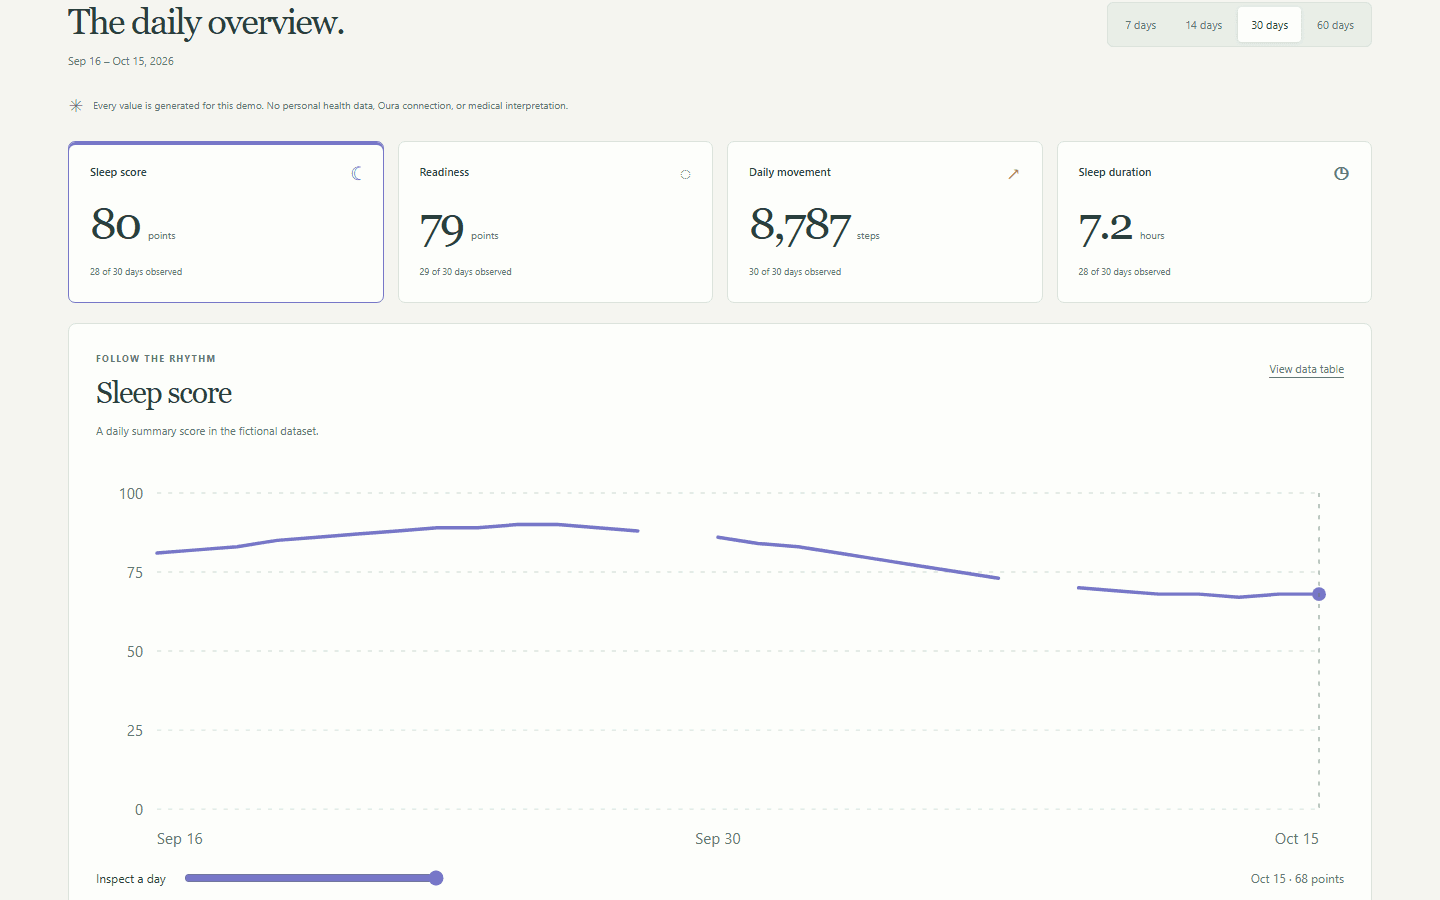
The gallery uses synthetic wellness data. It needs no Oura account or token and contains no personal health records.
03 / Under the hood
How the pieces fit.
- 01
Load
Request independent Oura data collections through a cancellable loading layer.
- 02
Reconcile
Keep successful collections and report failures at their own boundaries.
- 03
Prepare
Normalize dates and metric values for reusable visualization components.
- 04
Render
Display charts with explicit populated, empty, and unavailable states.
04 / Engineering judgment
Decisions & tradeoffs.
Treat partial success as useful
An optional collection should not make every other collection fail. Collection-level results let the interface communicate what is available.
Prevent stale results
Changing or clearing credentials invalidates in-flight requests. An older response must not repopulate a new session.
Make examples reproducible
Synthetic fixture data makes the public demo deterministic and keeps health records and API tokens out of the portfolio.
05 / Inspect the work